ATTENTIONThis FlexSim Community Forum is read-only. Please post any new questions, ideas, or discussions to our new community (we call it Answers) at https://answers.flexsim.com/. Our new Question & Answer site brings a modern, mobile-friendly interface and more focus on getting answers quickly. There are a few differences between how our new Q&A community works vs. a classic, threaded-conversation-style forum like the one below, so be sure to read our Answers Best Practices. |
flexsim.com |
#1
|
|||
|
|||
Efficient way to analyze queue content over time
Hello everybody,
how can I efficiently analyze the content of multiple queues over time and extract data about how often the content exceeds a certain limit and for how long the current content stays above the limit. In other words. I want to analyze the time vs. content charts from Flexsim Chart in a efficient way, when I run multiple repetitions of a model, without working with the huge databases manually. Thank you in advance! Jens |
#2
|
||||
|
||||
Hello Jens,
i think you know the solution to use two queues instead of one. The second one is in parallel to the first one and stores only the amount of items, which exceeds the limit. Jörg |
#3
|
||||
|
||||
Attached is a sample model that shows how you can get interesting statistics like this by using tracked variables.
What's in the model: There are four processing lines. On each Queue, I call a user command OnExit and OnEntry. Those user commands update the tracked variables. (They are in user commands so that I'm not repeating my code on every queue. I can update the code in one place and affect the entire system.) There are three tracked variables: 1. TotalContent: the total content of all four queues. 2. Overcapacity: a boolean value telling whether the system is over capacity or not. 3. TimeOverCapacity: a history of the durations when the system was overcapacity. Additionally, I have two user events near time 0 that set the Overcapacity's value to 2 and then 0 to control its y-axis values in the dashboard. On the dashboard, I have five statistics objects: 1. Model documentation that shows the current/maximum content and whether the system is overcapacity. 2. The total content vs time (tracked variable vs time). 3. Over capacity vs time (tracked variable vs time). 4. Time spent over capacity dot plot (tracked variable vs time). (This is a dot plot because the tracked variable it is showing is not time weighted.) 5. Time spent over capacity histogram (tracked variable histogram). (The model also has two global variables. One for setting the system's max capacity and another one used to calculate the time spent over capacity.) Another note: Because these values are stored using tracked variables and Dashboard Statistics, they can easily be added as performance measures to the experimenter so that you can analyse this data on multiple replications. Last edited by Phil BoBo; 11-19-2014 at 05:48 PM. |
The Following 4 Users Say Thank You to Phil BoBo For This Useful Post: | ||
Lars-Olof Leven (06-15-2012) |
#4
|
|||
|
|||
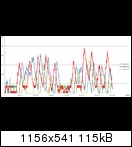
Thank you for your model Phil, I really like the real-time data capture. But as far as I understand it is not possible to analzye the values over several experiment repetitions. I don't want to use average values, but want to learn about the duration, frequency and peak value.
As you can see in the picture, I basically want to document the areas above the red dotted line. And not only for one simulation run, but all repetitions. Thanks again! |
#5
|
|||
|
|||
Another idea:
I could write the time, duration, peak and average content for each overflow-event of each queue (buffer) in GlobalTables. But ... this would leave me with almost 30 tables per repetition (if I would export them to excel after each run) Yaaay |
#6
|
||||
|
||||
Hello Jens,
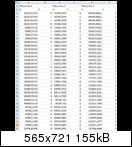
you can analyse in the end of replication trigger the stats of your queue, write the results to a global table or labels und use this data in the performance measure of the experimenter. The content- and time- values are stored in pairs under stats_contentgraph. The first value is the time, the second the content. Look only for values which are encreasing above your limit. Jörg |
The Following User Says Thank You to Jörg Vogel For This Useful Post: | ||
Jens Mühlheimer (06-18-2012) |
#8
|
||||
|
||||
Note that in version 6, this node has bundle data instead of subnodes, and you use getbundlevalue() to read its information.
|
The Following 4 Users Say Thank You to Phil BoBo For This Useful Post: | ||
Veronique Dossogne (11-07-2012) |
#9
|
|||
|
|||
Thanks for the info Phil. At the moment I'm still using v5 for this project, because I don't want to switch versions in between.
Just one more question: How can I circle through multiple selected objects? The code for my routine works to analzye the overflows of one queue, but I want to extract the data of a bunch of queues which I have selected. Basically like in the report function. Unfortunately I didn't find the report function in the tree to check out the code. Thanks again! |
#10
|
||||
|
||||
If you want to loop through all the red selected objects in the model, you can do this:
Code:
forobjecttreeunder(model()) { treenode object = a; if(switch_selected(object,-1)) { pt(getname(object)); pr(); } } If you want to loop through a specific group of objects, use port connections or a global treenode array. |
The Following User Says Thank You to Phil BoBo For This Useful Post: | ||
Jens Mühlheimer (06-21-2012) |
#12
|
|||
|
|||
A general follow-up question:
Is it possible to stack the content vs. time charts in Flexsim Chart. Or do you know of a way to do it in Excel, after exporting the data. In my opinion the problem is that graph actually shows a point cloud with connected data points. I would have to clusert the x/y data into e.g. hours. It's hard to explain for me, but I mean this: Queue A: Time: 3721s - Value: 5 Queue B: Time: 3872s - Value: 3 This should give me a total of 8 in the second hour on the Y-axis. Do you guys have any idea on this? Big thanks!! |
#13
|
|||
|
|||
Hey friends,
I still couldn't realize it in Excel, because I can't handle the data series. Do you guys have an idea? Any help is ultra-appreciated Thank you! |
#14
|
||||
|
||||
Hello Jens,
I attached a model (Version 5.1.2) which analyse the contentgraph data at the end of the simulation in the Trigger On Run Stop. The Analyse checks the content of two queues at discrete simulation times. In my model that is at 100, 200, 400, .. 1000. It does not help you in excel. For those of you, to use the model in Version 6, please read the whole thread. Jörg Last edited by Jörg Vogel; 12-03-2014 at 12:30 AM. Reason: Reload Attachement |
#15
|
||||
|
||||
Hello Jens,
I have some problems to analyse the data in excel, too. I am not an expert to transform the list data [time1, content1, time2, content2, ...]. But you can transform the data at the end of the simulation run in flexsim and write it in a global table [[time1, content1], [time2, content2],...]. Perhaps the analyse might be easier, if you combine time with the content change. Jörg |
Thread | Thread Starter | Forum | Replies | Last Post |
Virtual Queue Content | Phil BoBo | Tips and Tricks | 0 | 04-20-2012 12:34 PM |
Constant content of queue (or CONWIP) | Stefan Trabut | Q&A | 4 | 05-04-2011 06:16 AM |
Pulling from a Queue vs Sorting the Queue | Brandon Peterson | Tips and Tricks | 3 | 03-03-2010 01:27 AM |
Starting content in the Queue | Bartosz Misiurek | Q&A | 4 | 10-04-2009 02:25 PM |
How to get interval average,max,etc of a queue content ? | qin tian | Q&A | 5 | 02-14-2008 10:11 PM |